


YOUR CO2 EMISSIONS ARE NOT DRIVING CLIMATE CHANGE BY TRAPPING HEAT.
Part I in a III part series.
JOSEPH FOURNIER, PH.D.
The entire crux of all Climate Policies is the claim that our CO2 emissions trap heat and this trapped heat is the cause of all warming over the 20th and 21st centuries. You will see in this first of three articles, that the opposite is true.
Since Ramanathan et al.’s seminal 1989 paper titled Cloud-Radiative Forcing and Climate: Results from the Earth Radiation Budget Experiment was published, the scientific community has known that there are two so-called Greenhouse Effects operating within our atmosphere.
The literature shows that over the Satellite Era, it has been known that the declining Greenhouse Effect due to clouds has been largely or entirely offsetting the rising Greenhouse Effect due to rising CO2 concentrations.
Of course, this is not a true greenhouse, as greenhouses function by blocking convective cooling.
First, let us examine recent measurements confirming the existence of the Greenhouse Effect caused by rising CO2 within the 21st century.
The paper Observational determination of surface radiative forcing by CO2 from 2000 to 2010 by Feldman et al., published in Nature in 2015, presents clear-sky (no cloud condition) CO2 surface radiative forcing data attributed to a 22 parts per million increase in atmospheric CO2 between 2000 and 2010. Measurements were collected at two sites (Southern Great Plains and North Slope of Alaska) using Atmospheric Emitted Radiance Interferometer spectra (AERI). The AERI is a ground-based instrument that measures the downwelling infrared radiance emitted by the atmosphere.

I added the +/-ve Forcing or Feedback labelling to the figure to illustrate an unanswered question not addressed by the study. The sinusoidal monthly average CO2 concentration is a function of orbital forcing as the Earth transits its yearly journey around the Sun. This sinusoidal time dependence is emphasized as an example of where changes in atmospheric CO2 concentration is not indicative of a forcing, but rather a feedback to a forcing.
The study is historically important as it reports a statistically significant trend of 0.2 W/m² per decade, confirming theoretical predictions of the greenhouse effect from rising CO2 concentrations. Of course, this study assumes that the growth is entirely due to human intervention (i.e., is not a feedback).
Note that this ground based measurement is not a confirmation that outgoing long wavelength radiation (OLR) out the top of the atmosphere (TOA) is declining as CO2 concentrations are increasing.
When we examine the time dependence of OLR out the TOA, such as the recent publication from Hans-Rolf Dubal et al study, we find that OLR has increased in lock-step with declining total annual average cloud coverage and at a rate of approximately 1 Watt/m2/decade.
The inverse stepwise growth in OLR between 1997 to 2000 as the global average cloud cover (%) decreased by approximately 2 %, adds credence to the idea that this is indeed a causative relationship and not merely a correlation.

Hans-Rolf Dubal et al’s study is of outmost importance as it shows that OLR out the TOA is approximately 500% higher than downwelling IR radiation intensity is increasing as a function of rising CO2 concentration.
In other words, there is no evidence that heat is being trapped within the atmosphere as CO2 concentrations are increasing.
The reason for this discrepancy in magnitude and direction of change between downwelling IR radiation from CO2 re-emission versus increasing OLR is described by NOAA’s Kevin Trenberth in his 2009 study titled Global Warming Due to Increasing Absorbed Solar Radiation. In this publication, he acknowledges the declining greenhouse effect from decreasing cloud cover over the last two decades of the 20th century acts to offset the greenhouse effect from rising CO2 concentrations.

While this offset was not quantified, as I have above (i.e., 0.2 Watts down versus 1 Watts up), Kevin Trenberth specifically attributes warming to increasing absorption of short wavelength radiation (i.e., sunshine) as cloud coverage decreases.
I will now explain why there is a 5 to 1 ratio between increasing OLR and increasing downwelling IR radiation over the Satellite Era.
Below is the figure from Ramanathan et al’s 1989 study, showing the global all-sky long wavelength (LW) cloud forcing (CLW) map. Note that all CLW values have units of W/m2 and are positive, which by convention implies the net LW flux is oriented downward towards the surface.

Here is the updated list of cloud types, their longwave radiative forcing (CLW), and commonly observed altitudes:
- Deep convective clouds: ~60–80 W/m²; typically found at altitudes of 10–15 km.
- Cirrus clouds: ~30–50 W/m²; generally occur at 6–12 km.
- Altostratus clouds: ~20–40 W/m²; observed at 2–7 km.
- Stratocumulus clouds: ~10–20 W/m²; commonly at 0.5–2 km.
- Cumulus clouds: ~5–15 W/m²; usually form at 0.5–2 km.
These CLW values and altitudes are approximate and can vary based on regional and atmospheric conditions. To put these values in context, the LW radiative forcing associated with a doubling of CO2 concentration relative to the early 19th century is broadly accepted to be a mere 3.7 W/m2.
Higher CLW clouds, such as deeply convective types and cirrus clouds, are characterized by their high altitudes, significant optical depth, and ice-dominated composition. These clouds are highly effective at absorbing infrared radiation emitted by Earth’s surface due to their cold temperatures and strong emissivity in LW bands. The mechanism involves the absorption of OLR, followed by isotropic re-emission, with a substantial portion directed back toward the surface.
Just like with rising CO2 concentrations, but much more intense.

The lower CLW over the Pacific equatorial zone is due to the fact this region is dominated by Cumulus and Marine Stratiform clouds, whereas the high CLW over tropical forested regions is due to the predominance of Cumulonimbus clouds (below) towering as high as 12,000–20,000 meters (39,000–66,000 feet).


Cumulonimbus clouds form over tropical rainforests due to intense convection driven by high heat and humidity. Enhanced solar heating due to the low albedo (reflectivity) of rainforest canopies, creates strong updrafts, lifting this moist air to elevations where is cools and condenses.
According to Ramanathan et al, the global average CLW as of 1989 was 31.3 Watts per square meter, which is 8.5 times larger than the LW radiative forcing caused by a potential doubling of the tropospheric CO2 concentration.
Alternatively, Ramanathan et al stated that there would need to be a hundredfold increase in the CO2 concentration in the atmosphere in order to produce an equivalent LW radiative forcing to the global average CLW of clouds.
Now that we have defined the relative magnitude of the CLW of clouds relative to rising CO2 concentrations, outlined its dependence on cloud type and geography, we can now return to their time dependence.
The first data series that I bring to bear is from the Multi-angle Imaging SpectroRadiometer (MISR) instrument on NASA’s Terra spacecraft, which found that from March 2000 to February 2010, global average cloud height declined by around one percent over the decade, or by around 100 to 130 feet (30 to 40 meters).
Most of the reduction was due to fewer high altitude clouds (e.g., Cirrus).

The steep and rapid negative excursion during 2008, coincided with the most intense La Nina (cooling) condition that developed in the Pacific tropics during the first decade of the 21st century.
This is most intriguing, as La Nina events are also defined by an expansion of low altitude Marine Stratiform clouds, which while having a weaker OLR blocking effect, are the most powerful reflector of in-coming solar radiation of all cloud types.
In fact, some have estimated that a mere 6% reduction in marine stratiform cloud types, would produce a short wavelength radiative forcing (CSW) equivalent to a doubling of tropospheric CO2 concentrations (i.e., 3.7 W/m2).
In this scenario, warming of the surface would be due to increasing absorption of sunshine and not from an enhancement of a LW greenhouse effect.
In fact, a reduction in any cloud type would allow higher LW flux through the TOA simply due to the reduction of CLW AND from greater surface LW emissivity arising from the higher surface temperatures created by the absorption of elevated sunshine.
This perhaps is the crux of why observations show the 5 to 1 ratio for OLR flux through the TOA versus from downwelling IR radiation from rising CO2 concentrations over the past couple of decades.
This highlights that the El Nino Southern Oscillation (ENSO) involves a rapid short term restructuring of clouds, there-by altering the balance of in-coming and outgoing radiation within the atmosphere.

ENSO dynamic’s control over anomalous OLR flux is most pronounced over the Pacific and Atlantic equatorial zone, which shows OLR flux increases above average during La Ninas and decreases during El Ninos.
I will follow up on this in a subsequent article, by providing more concrete evidence on the relationship between ENSO states and deviations from average short wavelength (SW) and LW radiation flux over the Pacific tropics.
As we approach the conclusion of this article, it is necessary to acknowledge that while the global average CLW of all cloud types (i.e., 31.3 W/m2) is 8.5 times greater than the LW radiative forcing produced by a doubling of CO2 concentration (i.e., 3.7 W/m2), overall, clouds exert a NET COOLING effect on the surface environment.
Ramanathan et al use ERBE satellite data to show that the global shortwave cloud forcing (CSW) -44.5 W/m2. The negative flux indicates the flux vector is out through the TOA versus towards the Earth
Therefore, on average, clouds exert a net cooling effect on the surface equivalent to -13.2 W/m2 (i.e., -44.5 + 31.3 = -13.2).
In conclusion, warming over the Satellite Era has not been from increasing greenhouse effect from rising CO2 concentrations, and in fact, we have witnessed an expansion in LW flux out the TOA that is 5 times greater than the theoretical trapping rate of LW caused by rising CO2 concentrations.
Stay tuned as we dive deeper into cloud physics in relation to Climate Change.
If you enjoyed this write-up, please share and subscribe if you have not already. While I provide this service free of charge, I most definitely appreciate it when my Readers purchase a monthly ($8) or annual ($80) subscription.
This article (YOUR CO2 EMISSIONS ARE NOT DRIVING CLIMATE CHANGE BY TRAPPING HEAT.) was created and published by Joseph Fournier, Ph.D. and is republished here under “Fair Use”
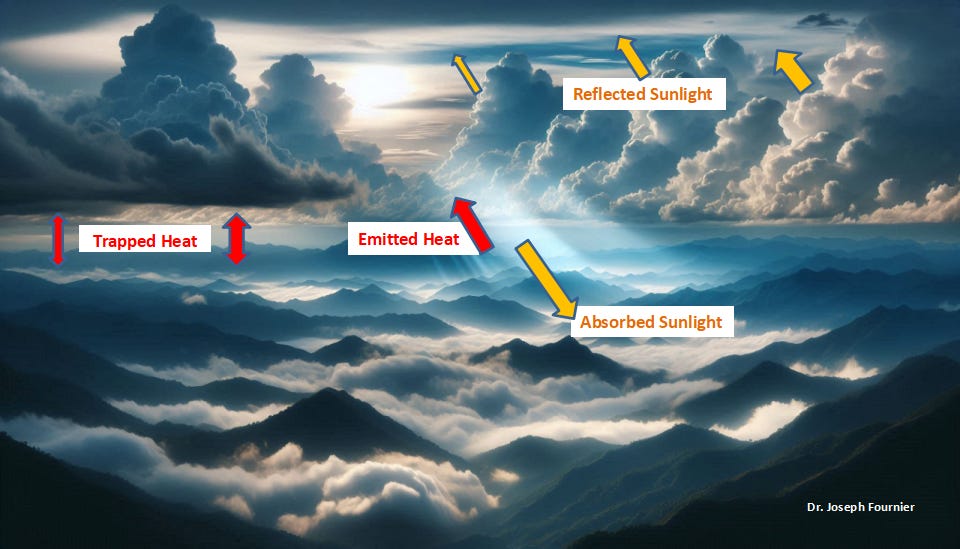
Featured image: Shutterstock (modified)

••••
The Liberty Beacon Project is now expanding at a near exponential rate, and for this we are grateful and excited! But we must also be practical. For 7 years we have not asked for any donations, and have built this project with our own funds as we grew. We are now experiencing ever increasing growing pains due to the large number of websites and projects we represent. So we have just installed donation buttons on our websites and ask that you consider this when you visit them. Nothing is too small. We thank you for all your support and your considerations … (TLB)
••••
Comment Policy: As a privately owned web site, we reserve the right to remove comments that contain spam, advertising, vulgarity, threats of violence, racism, or personal/abusive attacks on other users. This also applies to trolling, the use of more than one alias, or just intentional mischief. Enforcement of this policy is at the discretion of this websites administrators. Repeat offenders may be blocked or permanently banned without prior warning.
••••
Disclaimer: TLB websites contain copyrighted material the use of which has not always been specifically authorized by the copyright owner. We are making such material available to our readers under the provisions of “fair use” in an effort to advance a better understanding of political, health, economic and social issues. The material on this site is distributed without profit to those who have expressed a prior interest in receiving it for research and educational purposes. If you wish to use copyrighted material for purposes other than “fair use” you must request permission from the copyright owner.
••••
Disclaimer: The information and opinions shared are for informational purposes only including, but not limited to, text, graphics, images and other material are not intended as medical advice or instruction. Nothing mentioned is intended to be a substitute for professional medical advice, diagnosis or treatment.
Disclaimer: The views and opinions expressed in this article are those of the author and do not necessarily reflect the official policy or position of The Liberty Beacon Project.


Leave a Reply