


UK energy bills to increase by more than 20% to pay for the upgrade to grid systems needed to support ‘net zero’ targets.
‘Net zero’ seeks to pluck £240 billion from consumers via their utility bills.
PETER HALLIGAN
From here:
Britain will need up to £240bn of net zero upgrades
“Britain’s electricity network will require up to £240bn of upgrades to support clean power targets, the Department for Energy Security and Net Zero (DESNZ) has admitted.
In new estimates released by the Government, the cost of building new pylons and power lines will skyrocket in the next 24 years to achieve the Government’s net zero ambitions.
Let’s do some arithmetic.
£240bn in 24 years = £10bn a year.
From Brave AI:
“The average annual gas and electricity bill for a typical UK household (2–3 people in a medium-sized home) is £1,641 for the period until 30 June 2026, equating to approximately £136–£154 per month.
“There were an estimated 28.6 million households in the UK in 2024. Recent estimates for 2025 place the number at approximately 29.0 million to 29.5 million, reflecting a steady increase from 26.7 million households in 2014.
Call it £1,600 for 30 million households.
10 billion a year for 30 million households = £333.33 per household = an increase of 21% to just shy of £2,000 a year.
“The energy department has already warned that grid upgrades will cost £80bn by 2030.
However, the latest forecasts indicate that this is just the start of a much larger upgrade programme – with households poised to foot the bill.
The costs of grid expansion are loaded onto consumers’ energy bills to pay for upgrades carried out by the UK’s monopoly transmission operators: National Grid, SSE and Scottish Power.
This includes building new pylons across the country to transport electricity generated by renewables, including rural wind and solar farms.”
Arguably much of the upgrades are needed to replace obsolete and fully depreciated pylons, but that astill leaves an enormous bill to connec offshore wind farms and onshore solar plantations.
“Will Lochhead, a deputy director of DESNZ, told delegates: “The electricity grid we rely on today was largely built in the 1960s and was never designed for the scale of home-grown energy generation now being deployed, or the future levels of electricity demand.”
He added: “As we electrify transport, heating, industry and other sectors, electricity demand is expected to more than double by 2050.
““Meeting this demand would require between £100-240bn of investment in the electricity network by 2050.”
He cited DESNZ analysis suggesting that annual electricity demand will rise 10pc by 2030, 50pc by 2035 and more than 100pc by 2050, driven by the increased use of clean power technology such as electric cars and heat pumps.”
See how insidious government ‘net zero’ policies are?
Mandate EVs and heat pumps that nobody wants then set the price of electricity that supplies the energy, then increase the cost of the electricity because of the need to build the infrastructure.
Tortuous. High prices are killing UK industry which reduces demand for electricity.
Nobody works, everyone is consigned to energy poverty, nobody uses electricity= success! (/sarc).
You can also donate via Ko-fi – any amount from three dollars upwards. Ko-fi donations here:
https://ko-fi.com/peterhalligan
This article (UK energy bills to increase by more than 20% to pay for the upgrade to grid systems needed to support ‘net zero’ targets.) was created and published by Peter Halligan and is republished here under “Fair Use”
See Related Article Below
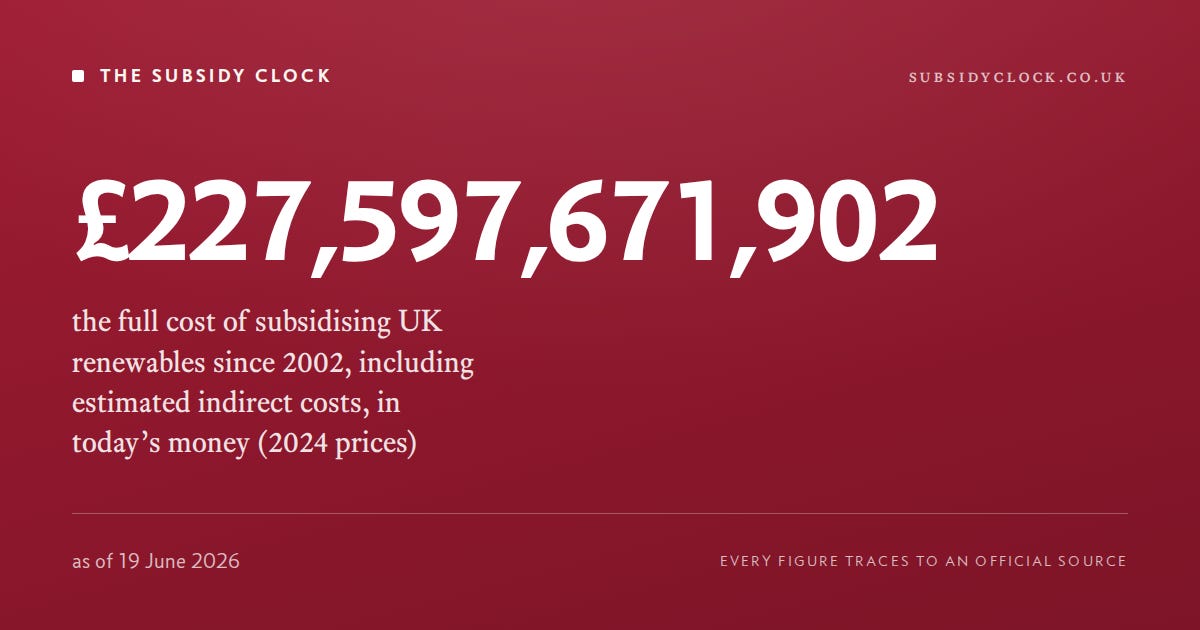
Introducing the UK Subsidy Clock
The government totals the cost of the energy transition nowhere. So I built a live meter that does — every pound traced to an official source, every step open to inspection.
RICHARD LYON
FOR SOME YEARS NOW, David Turver has been doing a job that properly belongs to the state. Month after month, on his Eigen Values Substack, he takes the published settlement data and reconstructs what the energy transition actually costs us: the Feed-in Tariffs, the hidden network and balancing charges, the subsidies that never quite make it into the headline figure. Forensic, sourced, and relentless. He does by hand, one careful article at a time, what no government department appears willing to total in public.
I have leaned on his work for years. This piece is partly to say so.
And partly to make a confession. Reading Turver, the thought that kept returning was not how much — it was why is this so hard to find out? The numbers are public. Every one of them. They sit on the data portals of the LCCC, Elexon, NESO, Ofgem, HMRC and DESNZ, in the formats those bodies happen to prefer, on the cadences they happen to publish, under the names they happen to use. What does not exist — anywhere — is the sum. No department adds them up. No minister is ever handed the total and asked to defend it.
After a while you stop believing that is an accident.
This is the seventh point of the blueprint at the end of my forthcomimg book The Energy Trap. The United Kingdom audits its money. The Office for Budget Responsibility marks every Budget against reality, and no Chancellor escapes its arithmetic. There is no equivalent for energy — the physical claim, and the financial one, behind every pound. There should be. Until there is, the cost of the largest peacetime industrial programme in the country’s history remains a thing the public is invited to feel strongly about and forbidden, by sheer scatter, from actually counting.
I do not think a minister is going to fix this. Opacity is not a bug they have failed to patch; it is the working condition of the policy. A number nobody adds up is a number nobody has to answer for. If the total is to exist, we are going to have to build it ourselves.
So I did. It is at subsidyclock.co.uk, and it has been running since I switched it on.
Here is what it does.
At the top is a live counter: the subsidies paid to British renewable and low-carbon generators since 2002, in pounds, ticking forward as the settlement data lands. It is past £100 billion in direct payments alone. Add the costs that reach you less visibly — through taxation, and through the network, balancing and carbon charges loaded onto every unit you buy — and the figure passes £200 billion.
Under the headline, the parts. Every figure splits into two layers that are never invisibly blended. There are direct subsidies, which are measured: Contracts for Difference, the Renewables Obligation, Feed-in Tariffs and wind constraint payments — money traceable to named generators in official settlement data. And there are indirect costs, which are estimated: the Capacity Market, the carbon taxes, the transmission and balancing charges that the settlement data does not pin to any one generator. Each estimate carries a published attribution rule and is labelled as an estimate. Where a figure combines the two, it says so. The measured headline is never quietly inflated with the guesses. That distinction is the whole discipline of the thing.
Then it lets you look. You can see where the money lands — the largest recipients grouped into the physical power stations they belong to, plotted on a map of Great Britain, each bubble sized by what it has been paid. You can see the cost over time, in today’s money and in the pounds of the day, and as a share of the electricity bill. And you can take the lot: every series downloads as a CSV, free to reuse, so anyone who wants to check me — or argue with me — starts from the same numbers I did.
None of it asks to be believed. Every retrieved data point links back to its source URL, the moment it was fetched, and a hash of what was fetched. The methodology page sets out each scheme, its source, and how confident I am in the attribution. The raw data is committed in full, so every published figure reproduces from scratch with no faith required. I would rather hand you the working than ask for your trust.
I won’t pretend it was easy to assemble. It was not. The data is strewn across half a dozen bodies in incompatible shapes, some of it annual, some daily, some buried inside indirect charges that take real work to disentangle without double-counting. That difficulty is not incidental. It is the moat. A cost spread thinly enough across enough schemes stops looking like a cost at all, which is a convenient property for a policy whose total nobody wishes to defend.
Which brings me to the part I care most about. The clock is built to be audited, not admired. If you find an error in a published figure, tell me — there is a corrections page and an issue form, and confirmed errors are fixed and logged in public, in the open, dated. Nothing is ever silently edited. When an official source revises its own history, that is logged too, alongside the old version, never over it. The point of radical transparency is that it has to survive being checked by people who would dearly love to catch it out. So check it.
A last word on Turver, because the debt is concrete as well as moral. The station groupings, the per-station Renewables Obligation allocation and the transmission-charge series all rest on datasets he compiled, each traced through to its primary source and cited on the site. Eigen Values is the kind of patient, unglamorous, properly-referenced work this whole argument depends on, and you should read him. What the clock tries to add is reach: to take the arithmetic he and others have done the hard way and put it behind a single live figure that anyone can send to anyone, in one link, and that nobody can wave away as a vibe.
The numbers were always public. They were simply never added together, because added together they ask a question. The meter is running while you read this. Go and watch it, and decide for yourself whose figures to trust.
And then do three things. A number nobody adds up is a number nobody answers for — so the job now is to make this one impossible to ignore.
One. Send it. Copy subsidyclock.co.uk and put it where the cost of energy is being discussed. Forward it to one person who would find it clarifying. Post it. Paste it into the comments under the next ‘bills are falling’ announcement. One link, no caveats, no login — that is the whole design.
Two. Use the number — there’s a kit for it. I have put everything you need on one page: subsidyclock.co.uk/share. It holds ready-made image cards, sized for a post and refreshed every day, so whatever you grab is always carrying the latest figure. Hit Download to save one, or Copy image to paste it straight into a post, an email or a thread. Run a website or a newsletter? There is a one-line snippet on the same page that drops the live counter onto any page as a self-contained widget. The next time someone tells you renewables are cheap, you reply with a current, sourced figure and a picture to go with it. All free to republish — just credit the clock.
Three. Check it, and subscribe. Try to catch it out. If you find an error, file it — confirmed mistakes are fixed in public, with your name on the correction if you want it. And subscribe here, so you don’t miss what the numbers turn up next: who is being paid, what the latest contracts lock in, and where the bill is heading.
That is how a thing the government totals nowhere becomes a thing everyone has seen.
The Energy Trap: Why the Renewable Energy Transition Can’t Work — And What Can is published in September.
This article (Introducing the UK Subsidy Clock) was created and published by Richard Lyon and is republished here under “Fair Use”

••••
The Liberty Beacon Project is now expanding at a near exponential rate, and for this we are grateful and excited! But we must also be practical. For 7 years we have not asked for any donations, and have built this project with our own funds as we grew. We are now experiencing ever increasing growing pains due to the large number of websites and projects we represent. So we have just installed donation buttons on our websites and ask that you consider this when you visit them. Nothing is too small. We thank you for all your support and your considerations … (TLB)
••••
Comment Policy: As a privately owned web site, we reserve the right to remove comments that contain spam, advertising, vulgarity, threats of violence, racism, or personal/abusive attacks on other users. This also applies to trolling, the use of more than one alias, or just intentional mischief. Enforcement of this policy is at the discretion of this websites administrators. Repeat offenders may be blocked or permanently banned without prior warning.
••••
Disclaimer: TLB websites contain copyrighted material the use of which has not always been specifically authorized by the copyright owner. We are making such material available to our readers under the provisions of “fair use” in an effort to advance a better understanding of political, health, economic and social issues. The material on this site is distributed without profit to those who have expressed a prior interest in receiving it for research and educational purposes. If you wish to use copyrighted material for purposes other than “fair use” you must request permission from the copyright owner.
••••
Disclaimer: The information and opinions shared are for informational purposes only including, but not limited to, text, graphics, images and other material are not intended as medical advice or instruction. Nothing mentioned is intended to be a substitute for professional medical advice, diagnosis or treatment.
Disclaimer: The views and opinions expressed in this article are those of the author and do not necessarily reflect the official policy or position of The Liberty Beacon Project.


Net Zero is already dead. Real science, simple sums.