


DR CARL HENEGHAN AND DR TOM JEFFERSON
The latest headlines suggest we’re heading for a doomsday scenario: ‘NHS ‘facing worst-case,’ says the Guardian. ‘Super flu strikes during perfect storm,’ headlines Sky. A “tidal wave” says the Independent, and health chiefs have warned there’s “still no flu peak in sight“, reports the Mail.
Putting aside the media drivel, what do the data say?
The surveillance data up to December 7th paint a very different picture.
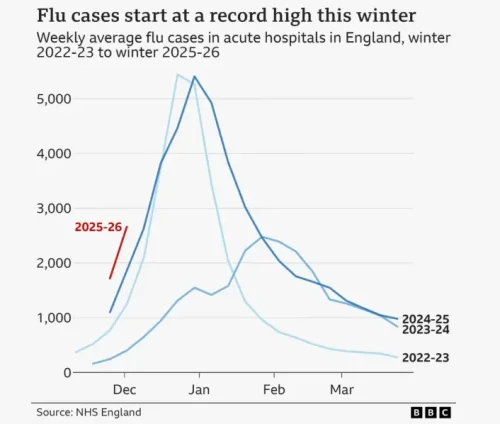
While many headlines are screaming that the ‘flu’ has come early, comparisons with the last two years indicate that it is within the range of previous years if you go back a little.

Looking at the data by age shows that the 5-14 year-old age group is the only one with positivity above the five-year average.

So, what about the end in sight that the NHS chiefs can’t see? If they examined the data, they might see that influenza positivity is flatlining. Students of Farr’s Law will know that what goes up must come down.

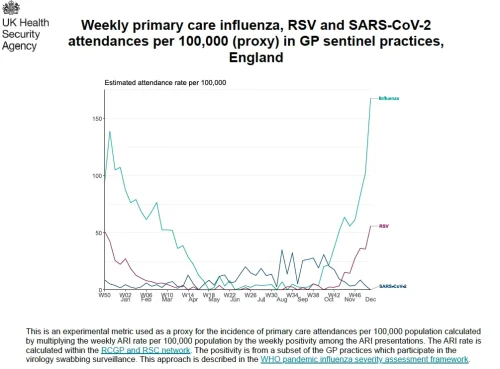
Weekly primary influenza, RSV and SARS-CoV-2 attendance data, per 100,000 people, provide a snapshot of community activity.
Within a specific GP sentinel system, very high consultation rates (more than 400 per 100,000 per week for influenza-like illness) serve as an operational signal of high activity – an epidemic. Current levels for influenza are well below this, around the 170 mark.
In Fleming’s ‘Lessons from 40 years’ surveillance of influenza in England and Wales‘, he presented weekly ILI rates per 100,000 from 1967 to 2007. From 1967 to 1986 there were six epidemics in which the weekly incidence rate of ILI peaked above 400 per 100,000. In the next 20 years (1987-2006), this rate was exceeded only once, in 1989-90.
Fleming’s surveillance work reported to us “that influenza activity is seen every winter, but its timing varies considerably”. Fleming notes that in the prior 20 years to his 2007 publication, some of the more serious epidemics peaked well before Christmas (1989-90, 1993-94, 1995-96).
Finally, as we turn to the hospital data, the situation becomes less clear. We’ve asked NHS England what the term ‘flu’ means in its hospital admission data. We’re still awaiting the answer. Our best guess is it’s a smorgasbord catch-all for respiratory agents and ‘influenza-like illness’.
The BBC reports “the numbers in hospital with flu is at its highest level at this time of year since records began – although they only date back to 2021”.
Oh dear, despite data dating back to 1969, ‘flu’ data began in 2021.
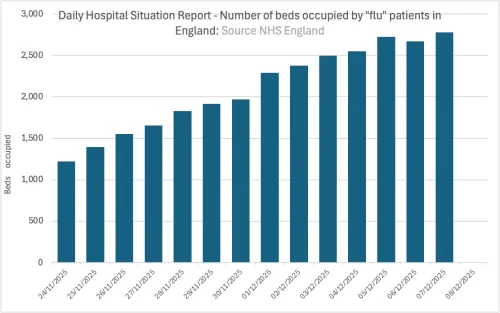
The latest data to December 7th shows that 2,781 patients were occupying beds with a label of ‘flu’.
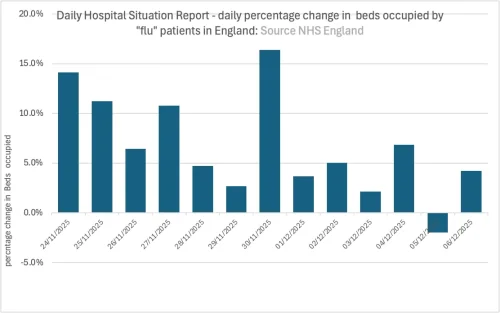
The key metric is the rate of change: values above the line indicate an increase in occupancy; values below it indicate a decline. At the moment, the rate of change doesn’t suggest anything concerning.
The latest syndromic surveillance data mirror this reflection:

The problem now, though, arises from how well hospitals can cope. Overcrowded, open-bay wards will ensure that hospital-acquired infections soar. As the community’s inevitable decline occurs, hospital data will lag, and cases will rise due to the inability to prevent transmission within hospitals.
This post was written by two old geezers who have serious problems reconciling the screaming headlines with the Government surveillance data.
Dr Carl Heneghan is the Oxford Professor of Evidence Based Medicine and Dr Tom Jefferson is an epidemiologist based in Rome who works with Professor Heneghan on the Cochrane Collaboration. This article was first published on their Substack, Trust the Evidence, which you can subscribe to here.

••••
The Liberty Beacon Project is now expanding at a near exponential rate, and for this we are grateful and excited! But we must also be practical. For 7 years we have not asked for any donations, and have built this project with our own funds as we grew. We are now experiencing ever increasing growing pains due to the large number of websites and projects we represent. So we have just installed donation buttons on our websites and ask that you consider this when you visit them. Nothing is too small. We thank you for all your support and your considerations … (TLB)
••••
Comment Policy: As a privately owned web site, we reserve the right to remove comments that contain spam, advertising, vulgarity, threats of violence, racism, or personal/abusive attacks on other users. This also applies to trolling, the use of more than one alias, or just intentional mischief. Enforcement of this policy is at the discretion of this websites administrators. Repeat offenders may be blocked or permanently banned without prior warning.
••••
Disclaimer: TLB websites contain copyrighted material the use of which has not always been specifically authorized by the copyright owner. We are making such material available to our readers under the provisions of “fair use” in an effort to advance a better understanding of political, health, economic and social issues. The material on this site is distributed without profit to those who have expressed a prior interest in receiving it for research and educational purposes. If you wish to use copyrighted material for purposes other than “fair use” you must request permission from the copyright owner.
••••
Disclaimer: The information and opinions shared are for informational purposes only including, but not limited to, text, graphics, images and other material are not intended as medical advice or instruction. Nothing mentioned is intended to be a substitute for professional medical advice, diagnosis or treatment.
Disclaimer: The views and opinions expressed in this article are those of the author and do not necessarily reflect the official policy or position of The Liberty Beacon Project.


Leave a Reply