

Mass migration risks making the UK and its neighbours ‘unrecognisable’. America could one day cut them loose
Donald Trump’s description of Europe, offered in an interview with Politico last week, was characteristically blunt: “What they’re doing with immigration is a disaster.” Unless this changes, some nations “will not be viable countries any longer”, with politicians like Sadiq Khan “elected because so many people have come in. They vote for him now”.
It was an assessment that came hard on the heels of the Trump administration’s National Security Strategy, which warned that Europe would be “unrecognisable in 20 years” and risked “civilisational erasure”.
[…]
Britain in 2050
Most discussions around migration are short-term in their approach. Short-term fiscal forecasts, short-term job needs for the government, and an assumption that once the paperwork is finished, everyone becomes British.
Most of the consequences, however, are long-term. Workers retire, tax contributions are cancelled out as the costs of old age accrue, and the culture of the nation shifts with composition. Even when an influx comes to an end, the change in the structure of the population retains its own momentum.
Fertility rates for migrants from South Asia and West Africa, in particular, are higher than those for UK-born residents. Some of these differences are maintained into subsequent generations, with research noting that “cultural” factors can “remain deeply rooted” in those born in the UK. The result is that while England and Wales are 74 per cent white British, the future is considerably more diverse. In 2014, 65 per cent of births were in this category. Last year, the figure was 54 per cent.
In other words, the US National Security Strategy is identifying a genuine shift in Britain. Within the reports that have made efforts to forecast it, the tipping point at which the white British become a minority is somewhere in the 2060s.
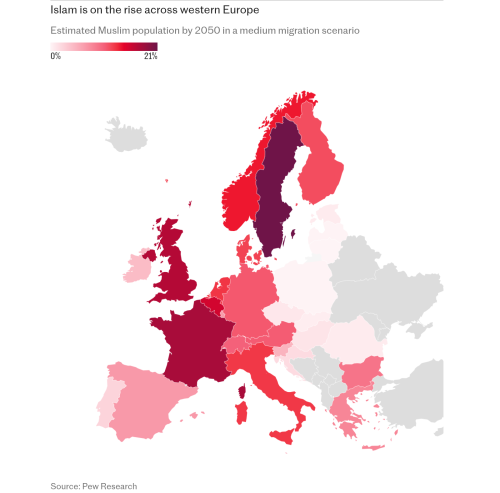
In 2017, the Pew Research Centre set out to forecast what Europe’s Muslim population would be in 2050. France, which deliberately restricts the collection of data on ethnicity and religion, is set to see somewhere between 13 per cent and 18 per cent of its residents follow Islam – the United Kingdom, somewhere between 10 per cent and 17 per cent. For the Continent as a whole, the figure was forecast to be between 7 per cent and 14 per cent – somewhere between a doubling and a tripling of the current level.
If this greater diversity were skin deep, or a matter of religious affiliation no more binding than a ticked box on a census form, then it would be of no interest to the Americans, or indeed voters across Europe.
The existence of long-lasting cultural differences, however, shows that the engine of assimilation may not be working as strongly as we might like. So, too, does the willingness of groups to live alongside one another. This brings us to the second part of the question – how far does demographic change translate into long-term cultural change? The key metric here is segregation versus assimilation.
A divided kingdom
We can measure the degree of segregation in parts of Britain through a simple metric. Take two people who live in the same area, and ask what the probability is that they share the same religion or belong to the same ethnic group. Then ask the same question about two people who live in a smaller part of the larger area. If people live jumbled together, then these numbers should be roughly the same. The larger the difference between them, the larger the degree of separation between communities.
In some parts of the country, things work well. Either groups are small enough to be absorbed into the whole without dominating areas, or people live happily as part of a melting pot. In other places, they don’t.
The probability that two randomly chosen people in Blackburn belong to the same ethnic group is 38 per cent. But the probability that two people in the same area of Blackburn do is closer to 59 per cent. This gap is the largest of any area in the country, but other places are not far behind.
In Bradford, the figures are 39 per cent and 60 per cent. In Birmingham, 23 per cent and 37 per cent. And so on through the list. Leicester, Oldham, Bolton and Derby are the local authorities that rank highest on this index of division, and are largely those you would expect from national discourse.
Measure by religion, instead, taking out those who refuse to answer or don’t believe, and the rankings are similar. All groups in the country cluster – people of all ethnicities are more likely to live alongside other people of the same ethnicity than national data would naively predict. With that said, there are differences in the intensity of clustering.
You are 14 times more likely to find two Bangladeshis living in the same small area, for instance, than you would predict from their share of the population, or eight times as likely to find two Pakistanis. The Chinese, Indian, Black African and Black Caribbean communities, on the other hand, are a little more dispersed, all roughly five times more likely to live alongside members of their community than random chance would indicate.
We tend to use the word “diverse” to refer to any area where people of different backgrounds live, but it frequently fails to reflect what life on the ground looks like. In some places, people live in communities that mix together. In others, they live on different streets, work in different markets and go to different churches.
It is perhaps unsurprising that the areas which have issues with integration also have issues with economic performance. In Bradford, 16 per cent of the people living in areas that are less than 50 per cent white British do not claim any sort of British identity, compared to 4 per cent in the areas that pass that threshold; 9 per cent can’t speak English well or at all compared to 1 per cent; 24 per cent claim Universal Credit compared to 12 per cent.
The Telegraph: continue reading
Featured image: The Telegraph

••••
The Liberty Beacon Project is now expanding at a near exponential rate, and for this we are grateful and excited! But we must also be practical. For 7 years we have not asked for any donations, and have built this project with our own funds as we grew. We are now experiencing ever increasing growing pains due to the large number of websites and projects we represent. So we have just installed donation buttons on our websites and ask that you consider this when you visit them. Nothing is too small. We thank you for all your support and your considerations … (TLB)
••••
Comment Policy: As a privately owned web site, we reserve the right to remove comments that contain spam, advertising, vulgarity, threats of violence, racism, or personal/abusive attacks on other users. This also applies to trolling, the use of more than one alias, or just intentional mischief. Enforcement of this policy is at the discretion of this websites administrators. Repeat offenders may be blocked or permanently banned without prior warning.
••••
Disclaimer: TLB websites contain copyrighted material the use of which has not always been specifically authorized by the copyright owner. We are making such material available to our readers under the provisions of “fair use” in an effort to advance a better understanding of political, health, economic and social issues. The material on this site is distributed without profit to those who have expressed a prior interest in receiving it for research and educational purposes. If you wish to use copyrighted material for purposes other than “fair use” you must request permission from the copyright owner.
••••
Disclaimer: The information and opinions shared are for informational purposes only including, but not limited to, text, graphics, images and other material are not intended as medical advice or instruction. Nothing mentioned is intended to be a substitute for professional medical advice, diagnosis or treatment.
Disclaimer: The views and opinions expressed in this article are those of the author and do not necessarily reflect the official policy or position of The Liberty Beacon Project.


Read: The Strange Death of Europe by Douglas Murray.
The Strange Death of Europe is a highly personal account of a continent and culture caught in the act of suicide. Declining birth-rates, mass immigration and cultivated self-distrust and self-hatred have come together to make Europeans unable to argue for themselves and incapable of resisting their own comprehensive change as a society.
This book is not only an analysis of demographic and political realities, but also an eyewitness account of a continent in self-destruct mode. It includes reporting from across the entire continent, from the places where migrants land to the places they end up, from the people who appear to welcome them in to the places which cannot accept them.
ISBN-10: 1472958004 & ISBN-13: 978-1472958006
Available from Amazon UK (The hardcover version, is at the time of writing, on sale -45% at only £10.50).