


Electrify everything?
Or: switch off at the mains?
JIT
Net Zero sceptics have seen in this week’s grid performance another example of the uselessness of renewables. We know they are useless at times; and that means they are useless throughout. They need to be held up by the burly arm of gas-powered generators. Without fossil fuels, the UK’s power would have gone off last week. [Renewables promoters are fond of noting how well their technology of choice is doing on the occasions when it delivers, but are less fond of admitting to their collapses. Meanwhile, politicians are seen on TV repeating Miliband’s mantra as if they believe it.]
See Notalot on the success of renewables, or the damning of them by faint praise.
However, the latest wind lull and dim days meant I made a few visits to the very useful grid.iamkate.com, which scrapes data on the UK’s grid from official sources and presents them in a very accessible form. One of the panels shows “all time” demand. It looks like this:
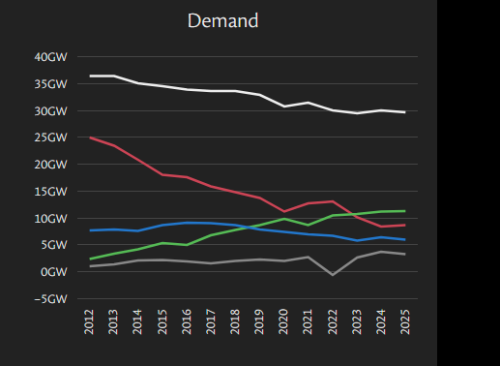
The white line shows total demand since 2012. Red is fossil fuel, green, as you might expect, renewables, blue “other” and grey imports. Demand in 2012 was 36.5 GW. In 2025 YTD, it is 29.7 GW. Of course, the average might go up a bit as we enter the end of the year. Last year, the average power was 30.1 GW. That’s a drop of 6.4 GW or about a sixth in 12 years.
Which got me wondering: why are we talking about electrifying everything, when we are making electricity so expensive that some heavy users are leaving and many of us are rationing our use?
[If at this point someone suggests the drop is due to “efficiency,” please look up Jevons’ Paradox.]
The graphic shown above is slightly misleading for reasons which will become obvious. If you go to DUKES (Table 5.5.a, total supply – imports + exports), you can calculate the power of the UK grid. Note, of course, this is an average power over the year.
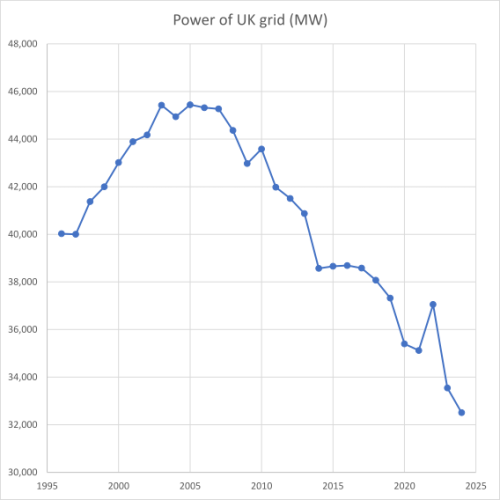
The earlier graphic omits the historical context. Now we can see that peak power was back in the days of peak UK – 2005.
Of course, since then an increasing quantity of whimsical generation has been added to the grid. This can be seen in the grid’s theoretical capacity factor: what proportion of available generation is actually being used to produce electricity?
[Aside: thinking about this rationally, an “ideal” grid would match generation with demand and never go wrong, never be down for maintenance, etc. There would be no excess capacity; it would have a capacity factor of 1. Of course, no such arrangement is possible. But we can measure how close to the idealised grid our own version approaches.]
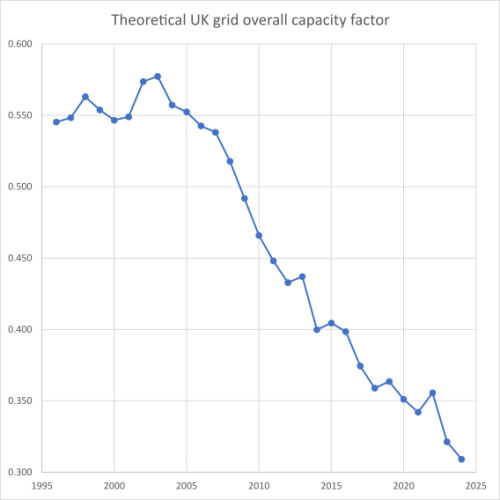
Here, I am over-dramatising somewhat by giving the renewables their “nameplate” capacity. Yes, it is unfair to expect them to get anywhere near that. The officially de-rated capacities for wind (on- and offshore) and solar are 0.43 and 0.17, as mandated by the Electricity Act 1989. In one year (2020) offshore wind nudged above 0.43 (0.45 to be exact), but that is the only time either form of wind has been anything other than below its “official” capacity factor. Solar has never been anywhere near. [Weighted average capacity factors, all time: onshore wind 25.1%, offshore wind 36.4%, solar 10.0%]
The closest our grid has come to an idealised grid in the series is 2003, at 0.58. On a de-rated basis, it’s now 0.45 (2024), or if you give renewables their nameplate as in the figure, 0.31. The figure shown is a measure of the duplication, or maybe triplication, in today’s grid. A sceptic might be able to claim that we now have the equivalent of three grids.
Maximum demand is now 47.5 GW (January 2024), and the sum of gas, oil and nuclear capacity is 41.9. Thank the stars for woodchips and interconnectors.
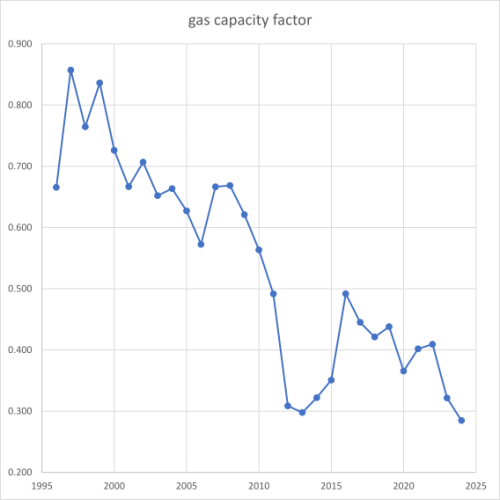
What about those gas plants? How busy are they? We might suspect that they are spending rather a lot of their time idle, now that they are having to give way to the renewables when they deign to deliver. Well, peak utilisation of gas was at 85% of potential in 1996; it is now below 30%. Thus, it could be argued that 2/3 of the gas fleet is standing idle. Of course, it still costs money to have them on standby, even if they are saving money on fuel costs. The dip in the early 2010s was due to a brief renaissance of coal.
Conclusion
We are supposed to be electrifying everything, but the trend is instead towards reduced electricity supply. Note also that the decrease in grid power has coincided with a rise in population. It’s also worth thinking about the way the market works: in a free market, over supply leads to reduced prices. This is not what is happening in our system.
Is the decline in electricity use something to be celebrated? Or is it a symptom of a decadent system propped up by increasingly desperate support?
Installed capacity: DUKES 5.12
De-rated capacity: DUKES 5.7
Electricity supply: DUKES 5.5
Electricity generated: DUKES 5.6
/message ends
This article (Electrify everything?) was created and published by Climate Scepticism and is republished here under “Fair Use” with attribution to the author Jit

••••
The Liberty Beacon Project is now expanding at a near exponential rate, and for this we are grateful and excited! But we must also be practical. For 7 years we have not asked for any donations, and have built this project with our own funds as we grew. We are now experiencing ever increasing growing pains due to the large number of websites and projects we represent. So we have just installed donation buttons on our websites and ask that you consider this when you visit them. Nothing is too small. We thank you for all your support and your considerations … (TLB)
••••
Comment Policy: As a privately owned web site, we reserve the right to remove comments that contain spam, advertising, vulgarity, threats of violence, racism, or personal/abusive attacks on other users. This also applies to trolling, the use of more than one alias, or just intentional mischief. Enforcement of this policy is at the discretion of this websites administrators. Repeat offenders may be blocked or permanently banned without prior warning.
••••
Disclaimer: TLB websites contain copyrighted material the use of which has not always been specifically authorized by the copyright owner. We are making such material available to our readers under the provisions of “fair use” in an effort to advance a better understanding of political, health, economic and social issues. The material on this site is distributed without profit to those who have expressed a prior interest in receiving it for research and educational purposes. If you wish to use copyrighted material for purposes other than “fair use” you must request permission from the copyright owner.
••••
Disclaimer: The information and opinions shared are for informational purposes only including, but not limited to, text, graphics, images and other material are not intended as medical advice or instruction. Nothing mentioned is intended to be a substitute for professional medical advice, diagnosis or treatment.
Disclaimer: The views and opinions expressed in this article are those of the author and do not necessarily reflect the official policy or position of The Liberty Beacon Project.


Leave a Reply